Eat less meat: UN climate change report

A 2019 IPCC report on land use recommended that people in developed nations should eat less meat. It calculated that the world’s meat intake contributes 8 gigatonnes of CO2 equivalent, which represents 23% of total emissions. Most of these CO2 equivalent emissions are actually from the emission of methane by ruminant animals, like cattle, sheep and goats.

This recommendation is challenged here.

Lies about Methane emissions

The question to be asked, “Did the authors deliberately confuse the issue by using a formula to calculate CO2 equivalent emissions instead of discussing methane emissions, or was it an accident?”

Methane has an atmospheric half-life of around 9.5 years, which represents an average life of 13.5 years.

A rough guide in calculating the increase in the atmospheric level of methane is to compare the current estimated methane emissions with the estimated methane emissions 14 years ago.

An estimate of cattle/buffalo numbers in 2011 was 1,396 million, and the number in 2001 was 1,301 million. This is an increase of 95 million animals. For 2011, a detailed study indicated that methane emissions from ruminants was 107 millions tonnes.

Treating this as an appropriate guide to calculate the proportionate increase in the number of animals, this works out to be 7.3 million additional tonnes of methane, or 0.261 gigatonnes of CO2 equivalent. This is only 3% of the 8 gigatonnes cited earlier.

There are three factors here. Firstly, the cited report failed to take into account the fact that the half-life of methane in the atmosphere means that it doesn’t last: it mostly replaces methane already there. Secondly, methane is lost to the atmosphere by being transformed into CO2, but the effect is truly tiny (about 5/1000ths). Thirdly, in calculating the 8 gigatonnes figure, other non-methane factors were taken into account that have nothing to do with methane. Despite this, the 8 gigatonnes is clearly overstated.

Meat is not the most important factor in atmospheric methane

A recent report by Saunis, et al., calculated that the most likely break up of methane emissions in 2011 was as follows:

  • 385 mt from natural sources.
  • 107 mt from ruminants (cattle, sheep, etc.).
  • 30 mt from rice cultivation.
  • 46 mt from fugitive emissions from coal.
  • 88 mt from fugitive emissions from natural gas.
  • 31 mt from biomass (burning dung, etc., for cooking).

However, even this report does not explain all the historical fluctuations in the atmospheric levels of methane. Yet it is not hard to explain them: the most likely explanation is careless, but significant, additional losses of natural gas through gas leaks. The wild fluctuations in methane levels around 1990 had almost nothing to do with additional meat consumption; it was all about gas leaks. In 2011, gas leaks can be estimated to have contributed an additional 137 mt of methane in the atmosphere, with most of those emissions happening prior to 2004. Even now, I estimate that new additional emissions each year of 43 mt can be attributed to gas leaks beyond the numbers in the Saunis report.

Rather than fiddling with social engineering to cut meat consumption, cuts to methane emissions will naturally follow from the planned actions of cutting all coal mining and use, and cutting 90% of natural gas use. This will result in methane atmospheric levels reducing every year from the date that happens. A reducing level of methane in the atmosphere will happen even if red meat consumption increases in line with population.

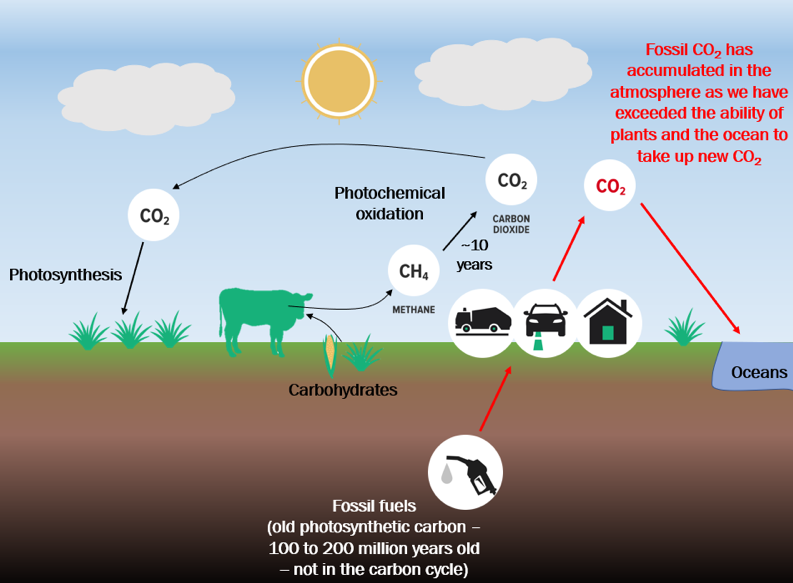
It is not true that every pound of meat that is eaten results in a permanent increase in methane levels. It not even true that ruminants are adding to CO2 in the long-term, since the CO2 from methane actually comes from eating grass, not from underground. Today’s meat may result in higher methane levels in the atmosphere, but it is “here today” and gone in years to come. It is a part of the normal cycle.

Meat in the methane and CO2 cycles
Meat in the methane and CO2 cycle

The meat story as popularly considered and found in scholarly articles is not correct. The impact of meat on methane levels has been grossly exaggerated and the truth should begin to be told. The next UK Climate Change committee report should be revised.

Implementing a carbon tariff

A carbon tariff will be required as a way of encouraging compliance in the event that COP26 arrives at a firm plan to cut real emissions to nearly zero by 2050 or 2060.

COP26 Glasgow

A consensus appears to be emerging that 2050 or 2060 should be set as the date when CO2 emissions should reach nearly zero, sometimes referred to as “net zero”.

Net zero, as a concept, is quite problematic. It envisages continuing to produce enormous amounts of CO2 and then burying it underground in what is described as “secure storage.” In addition, it also contemplates generating a large amount of electricity from biomass (possibly trees and thinnings) and burying this as well.

On the other hand, real zero is an unambiguous concept, but it is not necessary, at least in this century. This is because, even if natural gas and oil-based fuels are only cut by 90%, it is likely that global average temperatures will stabilise at the level when real CO2 emissions are cut to that level and all coal use is ended. Strategies to make cuts of this kind are discussed elsewhere. Some of these strategies are already being implemented: mostly they just need to be ramped up.

A target that could be agreed at COP21 is that all coal use be ended by 2060 and that the use of natural gas and oil-based fuels be cut to 10% of current levels by the same date. This is not the ideal case, which is targeting for 2050, but it may be the practical way forward.

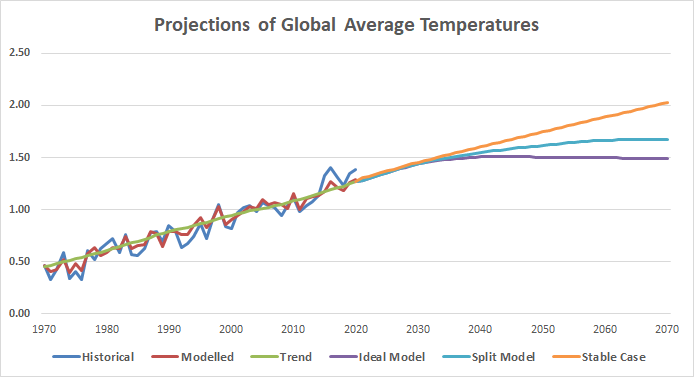
Some nations may be willing to aim for 2050 as the end date instead of 2060, and this is to be encouraged. A 2050 end date could result in a rise in average global temperatures of 1.5C (the “Ideal Model”); an extension out to 2070 end date (only for non-OEDC nations) could result in average global temperatures of 1.7C (the “Split Model”); if emissions continue as at present it could result in average global temperatures of 2.0C (the “Stable Case”).

Projections of global average temperatures out to 2070 with different strategies.

A carbon tariff is required

If COP26 is to be a success, there must be confidence in each nation that “other nations” will not exploit the system to enable them to gain a competitive advantage by continuing to use cheap, but CO2 intensive, fuels, like coal and natural gas. A carbon tariff could help to provide this level of confidence.

A carbon tariff could be applied to the exports from any nation that fails to meet the targets agreed at COP26. It would not require voluntary action by the defaulting nation, since the tariff will be automatically imposed by the importing nation that would impose the tariff in accordance with a new WTO rule. This rule would be agreed by the Glasgow conference and adding into the WTO rulebook.

When is a carbon tariff triggered

Let us say that the end date for “net zero” or nearly zero (whichever is agreed) is 2060 and the start date is 2020. Then let us assume that CO2 emissions will be reduced by equal increments until 2060. The carbon tariff would be triggered if the International Energy Agency deems that a nation’s CO2 emissions are not tracking down in line with the COP26 agreement.

For most nations, a fair way of calculating the target level for each year would be for the IEA to calculate per capita emissions. The USA’s per capita emissions could be starting point (plus a small contingency). The end point could be agreed at COP26 (such as zero for coal and 10% for natural gas and oil-based fuels). A straight line could be drawn between these two points and that would represent the target level for each year.

For some oil-producing nations this would not be fair (for example Qatar, with a small population and much oil and gas production). In this case, the target line could be drawn between the current level of CO2 emissions (plus an appropriate contingency) and the end point would be the level of emissions agreed at COP26. It also should be understood that emissions from small oil-producing nations actually depend on consumption in other nations.

The quantum of the carbon tariff

A carbon tariff of 20% is quite arbitrary, but it would serve the purpose of providing a very strong incentive to keep to the reductions agreed.

Some nations for whom a per capita target is appropriate are most at risk of breaching the target line in the early years. These are the USA, Australia and Canada. It is expected that each of those nations is already well motivated to cut its CO2 emissions.

Small oil producing nations are also a risk of breaching the target if the target is not set after taking their special situations into account.

All other nations are not likely to be faced with a carbon tariff until many years later. If the EU do not make any cuts it could come in 2040, but it is assumed that the EU will be aiming for 2050 target date and should have no difficulty in staying under the target line. The same should apply to all other nations.

The economic penalty of radically falling exports that would arise from a failure to avoid having a carbon tariff imposed by importing nations could be quite severe. If a carbon tariff is agreed, each nation would be well advised to act prudently in this matter.

Baseload power in a renewable environment

Baseload power should be reconsidered in the light of the recent blackouts in Texas. While storage can do much to reduce the frequency of blackouts, storage is limited by the electricity that has been already “stored” in either batteries or via pumped-hydro.

In Texas this week, millions of people were stuck without electricity. There wasn't enough baseload power.
In Texas this week, millions of people were stuck without electricity

The primary role of batteries is to manage the difference between supply and demand for electricity during the day. If the surplus supply is greater than the capacity of the batteries, the surplus can be diverted to pumped-hydro facilities, if available. These can be configured to provide much greater electricity “storage” capacity.

In the event that demand exceeds supply over many successive days, it is possible that both batteries and pumped-hydro dams will be emptied. In this case, blackouts have just been deferred for those initial days and not avoided for the whole period. A baseload power strategy is required to reduce the possibility of a catastrophic failure of electricity supply during an unusual climate event.

How much baseload power is required?

The maximum quantum of baseload power required is the maximum unavoidable demand. This is equal to the maximum demand at any time at day or night less the demand that can be cut off by fiat of the regulator, or by negotiation with business. Things that can be planned to be shut off include:

  • Aluminium and steel works can be put into standby mode provided sufficient warning is provided.
  • Domestic and business use of electricity can be scheduled to be shut down in different suburbs and towns at different towns for a short time in order to reduce the peak load.
  • Certain usages can be banned, depending on the predicted willingness of individual users to comply. For example, cooking the evening meal could be postponed until a later hour or brought forward. In a country like Australia, this would not be welcomed but compliance is likely to be widespread. (For the impact of the 6 pm peak see this analysis done a few years ago for South Australia.)

There will be political price to pay for any requirement to reduce demand for electricity, but there will also be a political price to pay if the cost of more baseload power is more than necessary. It is a matter of balancing costs and risks.

Renewables will still contribute to power in a crisis

It is not possible to guarantee that renewables can supply any level of electricity, but the reasonable probability of renewables being able supply a certain level of power can be calculated. The likelihood of an unusual climate event significantly causing the electrical “storage” system to be exhausted will be reduced wherever there is a wide distribution of renewable energy resources. In Australia, this could encompass all the east coast states plus South Australia. The chance of an unusual climate event having the same impact everywhere is almost zero, but some effect can always be expected.

In calculating the quantum of power that can be sourced from renewables in an extended climate-change crisis one must realistically consider impact of such an event if it happened and consider the probability of such an event, say in the next thirty years. This is a matter for engineers and statisticians to consider.

These calculations will not be easy, but they can be done. Once completed, a reduced maximum quantum of baseload power outside the renewable sector can be calculated.

Gas-fired electricity generators can be used

Even though this conflicts with the idea of “net zero” emissions, there can still be a case for at least 10% of the current use of natural gas to be continued into the future while still holding firm to the target that temperature increase since industrialisation are to be held at 1.5C.

The advantage of continuing to use gas-fired electricity generators for peaking electricity demand is that if an unusual climate event happens that leads to electricity supply being curtailed, the peaking-demand generators can be turned on in off-peak times in order to generate electricity to meet the demand and, if possible, to replenish the electricity “storage”.

The electricity that can be supplied by gas-fired electricity in this crisis will also reduce the calculated maximum quantum of baseload power that is required outside of renewable resources.

Meeting the final baseload power requirement

There are three available methods of providing baseload power:

  1. Electricity from biomass.
  2. Electricity from geothermal resources.
  3. Electricity from nuclear power.

The downside of burning biomass is the possible negative environment impact of doing this on a large scale.

Geothermal resources, deep underground, provide an excellent means of providing a constant supply of electricity with virtually no environmental impact (even though a project near the Cooper Basin in South Australia was abandoned because it was not economic at the time). Under the scenario considered here, the electricity produced from geothermal sources could be immediately stored and dispatched as required.

Nuclear energy needs to find a new spot in the world’s electricity network. To do this it will be necessary for its advocates to increase the community’s confidence in the long-term safety of nuclear-powered electricity generation. This could be possible via the smaller modular nuclear molten-salt reactors that are currently being considered.

Final baseload power requirement

Using the Australian National Energy Market as a guide, let us try some rough numbers to calculate a safe capacity:

  • Peak demand capacity: 2019-20: 35,626 MW.
  • Measures to manage demand reduced anticipated peak demand in a climate-related demand crisis by, say, 25%.
  • Geothermal contributes, say, 6% to supply by continuous running = 1318 MW (running 24 hours operation 365 days = 11.55 TWh out of 192.4 TWh).
  • Assume gas-fired peaking capacity (for 1 hour a day) contributes 5% to peak supply to help meet demand = 1,781 MW.

We now move to model total electricity demand per day in a climate-related demand crisis:

  • Total electricity demand in a year = 192.4 TWh
  • Daily electricity demand in a day less 25% = 395,000 MWh
  • Demand that is met by peaking capacity = 1,781 MWh
  • Additional capacity from peaking = 40,963 MWh
  • Daily demand met by geothermal = 31,632 MWh
  • (Normal demand met by wind and solar renewables = 493,000 MWh)
  • Daily demand met by renewables at 25% (assuming storage has been exhausted) = 123,250 MWh
  • Net demand to be met by other baseload capacity = 197,394 MWh.

If the other baseload capacity to meet this situation was able to run 24 hours a day, the installed baseload capacity would need to be 10,000 MW (including a 25% contingency). This represents about 30% of peak demand. If a climate-related crisis is expected to result in increased demand, this will need to be taken into account by providing additional baseload power.

Conclusion

On this indicative numbering, electricity from intermittent sources like wind and solar should, on average, be less than 70% of supply. This can be managed by contracting the above pure baseload generators at a fixed price with a guarantee that these generators will meet the available demand before any intermittent supply is taken up. Unless intermittent sources are subjected to this kind of control, baseload power sources will atrophy and close due to lack of use. Therefore, they will not be available when they are needed.

Of course, these numbers are only an indicative example, with other factors to be included as required, but they do show that 100% renewables could bring problems in its wake.

If the first-call use of baseload capacity is not maintained the whole system is likely to become unstable, leading to serious problems in the supply of electricity to those who desperately need it.

Remove Greenhouse Gas Emissions

It is feasible to remove greenhouse gas emissions in order to cap global warming at around 1.5C. There are simple and well researched ways to do this. Some are under way but they need more work. Ethanol has been overlooked as a serious strategy. It is argued that all of these ways to cut the emissions of greenhouse gases should be done.

Three approaches are considered here and the likely outcomes predicted based on mathematical modelling of the last 170 years and then predicting out to 2070. This requires estimating the likely greenhouse gas levels at the end of each year.

The ideal case, at least as presented here, is a scenario in which it is predicted that it is possible to hold the increase in global average temperature to 1.5C, stabilising at that level. This requires all nations to participate while holding to the timeline indicated below.

While all nations should not find the actions presented here to be an insurmountable challenge, some non-OEDC nations could consider that the timeline for action will be too difficult for them. To cover this situation, a second scenario is canvassed. In this scenario the timeline for implementation for non-OEDC nations starts in 2050 and goes out to 2070. Under this scenario, the predicted outcome is an increase in global average temperature of 1.7C, stabilising at that level.

Finally, we consider a third scenario, which is the continuation of greenhouse gas emissions at the current level out to 2070. The predicted outcome is an increase in global average temperature of 2C and a steady and unrelenting increase in global temperature after that date.

It is noted that these predictions depend upon not encountering a “black-swan” event (being something not already seen in the last 170 years) over the period of the predictions.

Strategies in the “Ideal Model”

Remove coal by 2050

The removal of coal from electricity generation is already happening in OEDC nations. For modelling purposes, it is assumed that this will be completed for all nations by 2050.

Electricity

Removing coal from electricity generation is the most developed strategy for reducing greenhouse gas emissions, at least in OECD countries.

  • Wind and solar are currently the favoured options in most nations. However since they do not always provide dispatchable electricity, methods of storing electricity and then dispatching it to users are required. Presently, the options available to “store” electricity are pumped-hydro, liquid air and batteries. Liquid-air and batteries can provide a useful mechanism to handle the daily fluctuations in supply and demand; pumped-hydro can handle longer-term fluctuations in supply and demand.
  • Hydro facilities can provide electricity each day as required. Very large facilities can help to manage longer-term fluctuations in supply.
  • Nuclear energy and geothermal energy can provide electricity each day as required.

All storage methods share a single limitation: each can only provide dispatchable electricity if it has previously been stored. In the case of unexpected demand beyond the capacity of renewable resources plus storage to meet, either in the short term or more significantly in the medium term, they do not provide a fall-back facility. Nuclear and geothermal energy are the only currently available fossil-fuel free options that can fill the gap (if they too have capacity). Concerns relating to the safety of nuclear energy may possibly be eliminated by using relatively small molten-salt reactors. If fossil-fuel is to be rejected as a source for electricity generation, this matter should be seriously considered.

Steel

Using hydrogen gas as a substitute for metallurgical coal is being actively explored in several countries. In implementing this, the cost of producing hydrogen gas could be an issue.

Other approaches are already being tried, as discussed here.

Remove 90% of oil-based fuels used for all vehicles and ships by 2050

Action on parts of this plan can be commenced immediately. For modelling purposes, it has been assumed that implementation will begin in 2025 and finish in 2050.

Cars

It is physically and economically feasible to replace all petrol and diesel driven vehicles with ethanol driven vehicles by 2050. It is recognised that, with the falling price of oil, there will be a comparative-cost penalty that cannot be allowed to derail the implementation.

  • Producing ethanol from crops such as sugar cane and corn, while relatively competitive, demands too much land to be a complete solution. Less land-intensive approaches are required. Ethanol from algae has been explored, but it is not yet viable. A viable method of obtaining ethanol from bamboo has been explored. It is accepted that more research is required to develop a solution that will enable the transition to 100% ethanol. (It could be easier to do this than to produce and store hydrogen.)
  • An ethanol-based vehicle fleet has already been established in Brazil. This nation has implemented technology that will allow petrol vehicles to accept any ethanol mixture, from 100% down to 0%.
  • To implement an ethanol-based strategy, all new vehicles must be equipped with this technology. Governments could consider a small government subsidy to make this cost-free to users.
  • Install refuelling bowsers committed to provide a variable ethanol mixture until 100% ethanol supply is sufficiently secure. Variable mixtures to be provided until around 2050.
  • Ethanol to be produced in countries with surplus agricultural capacity. Growing crops in regions that do not require irrigation must be a priority, for example, growing sugar-cane in tropical and sub-tropic regions, preferably delivered via locally-owned and managed ethanol facilities in the countries in these regions. This approach will provide those countries with a way of relatively pain-free economic development.
  • Limit the amount of ethanol required for this change by preferencing plug-in-free ethanol/electric hybrids instead of pure ethanol vehicles.

Trucks

Research in the USA has shown that large trucks can be designed and built to run on ethanol. Change over to this type of engine can be done by 2050. This will require the following steps:

  • Build the engines.
  • Ensure sufficient ethanol supply available to reliably provide all ethanol-driven trucks with fuel.
  • Provide refuelling bowsers that can provide 100% ethanol.

Ships

Research has yet to be done on the best way to convert ships to run on ethanol, but it is assumed that this can done.

Fully-electric vehicles

Fully-electric vehicles are increasingly popular in Western countries. Yet it is difficult to see them as a global replacement for petrol and diesel fuelled vehicles:

  • The demand for electricity from this approach will require a much larger electricity-generating sector. This will be difficult for countries that are already electricity poor, especially in the absence of relatively cheap coal-fired generators.
  • The demand for finite resources in order to build fully-electric cars will create supply difficulties, with the world possibly coming close to exhausting such resources. The supply of cobalt is already under stress and alternatives are being developed. The future supply of copper and lithium could also be a limiting factor.
  • Fully-electric cars at present are much more expensive that plug-in-free hybrids. While this cost differential should reduce over time as a result of manufacturing efficiencies, it also likely that supply problems could cause the opposite outcome.

Remove oil-based fuels for aeroplanes by 2070.

At present, hydrogen for aeroplanes is just an idea, although widely canvassed. For modelling purposes, it is assumed that it will begin in 2050 and be completed by 2070.

It is now recognised that it is unlikely that batteries will be a viable fuel source for long-distance aeroplanes. Currently attention is being given to using a hydrogen-based fuel. This will require three things:

  • A more cost effective way of producing hydrogen gas is required (possibly from water through electricity).
  • A cost effective way of compressing hydrogen gas is required.
  • The proposed aviation fuel is to be proven to be reliable.

It is assumed that this can be done by 2070.

Remove 90% of natural gas from electricity generation by 2050

Natural gas is currently considered the cheapest and most effective way to provide peaking electrical energy. Removing natural gas from the equation will require the implementation of similar strategies to those required for the removal of coal from the electricity-generation process.

Reducing the use of natural gas will have an another benefit: reduced fugitive gas emissions will progressively cut the level of methane in the atmosphere.

This change is unlikely to happen until 2040 and could be completed by 2050.

10% of natural gas has been retained in the model to allow for additional peaking capacity to be retained in the system to cover the times the electricity grid is under unexpected demand stress.

Remove 90% of natural gas from building heating and industry by 2070.

Natural gas provides a versatile fuel for heating. It works in all climates and is relatively non-polluting. The remaining problems are the CO2 generated from burning it and the methane lost during the processes of extraction, transportation and use. The following strategies could be implemented to remove this fuel use:

  • Increase the volume of methane trapped from organic waste.
  • If a cost efficient way of producing hydrogen gas from water through electricity is developed, it can be used for heating.
  • Electrically driven heat pumps can be used for heating provided an appropriate system is chosen and it is shown to be cost effective.

It is assumed that these strategies can begin to be put in place by 2050 and be fully implemented by 2070.

Cut CO2 emissions from the manufacture of cement by 2070.

  • Methods to be developed so that CO2 from cement manufacture can be eliminated.

Other Actions

These are things that are being done in some places and should be done everywhere straightaway.

Ideal Outcome

If the above strategies to remove greenhouse gas emissions were adopted by all countries, the predicted result is that global average temperatures increases since Industrialisation will be held to 1.5C by 2050 and beyond, with a standard error of ± 0.11 (mostly due to El Niño and La Niña changes in some years and volcanic eruptions).

The modelled values are based on a calculated formula that takes into account the forcing from the additional greenhouse gases in each year and deducts the estimated cooling effect of atmospheric sulphur. More details on the formula can be obtained here.

In this model, no allowance has been made for capture of CO2 and its storage underground. This could be considered, as a last resort, by nations unable to follow this “Ideal Model.”

Split Model

The Split Model covers the situation of the OECD nations following the “Ideal Model,” but the other nations deferring taking these drastic action to remove greenhouse gas emissions until between 2050 and 2070. In this case, the predicted result is that global average temperatures increases since Industrialisation will be be 1.7C, with a standard error of ± 0.11 (mostly from other cyclic climate factors).

Stable Case

The starting point for the Stable Case is the assumption that emissions will continue out to 2070 at the 2018 levels of emissions. It therefore is called the “Stable Case.” (It is assumed that, in the period to 2030, reductions in CO2 emissions after 2018 in OECD nations will be offset by “catch-up” emissions in the other nations.) The stabilising of globalised CO2 emissions was the substantive result of COP21 Paris.

We can expect a temperature increase of around 2C by 2070 if the world follows the Stable Case, with further increases after that date.

Modified IEA-based model

An IEA report, Energy Technology Perspectives, designed to model the actions required to cut greenhouse gas emissions, assumed that significant real CO2 emissions will continue well past 2070. Therefore, carbon capture, utilisation and storage was an important part of its predicted “net zero” outcome. Since most of its predicted actions can be envisaged as taking place towards 2070, it is likely that a stabilised temperature increase of around 2C will be the result of its strategies, around the outcome of the Stable Case for 2070, but with no further temperature increases.

However, using the IEA report framework, it remains possible to consider cutting CO2 emissions substantially by 2050 even without carbon capture and storage.

A “Modified IEA-based model” of this kind would deliver a global temperature increase of 1.6C, being a result somewhere between the other two main models. The downsides of this approach is that it demands virtually immediate action and some very costly infrastructure. It is unlikely that either of these elements will be delivered. On this basis, the “Ideal model” is to be preferred: it offers a better outcome as well as implementation being less costly and less disruptive.

Comparing temperature outcomes

Different outcomes using different removal strategies.
Projections of Global Average Temperatures

Conclusion

While all the actions to remove greenhouse gas emissions described here are important, there are two actions that will make the biggest difference to the final temperature outcomes.

  1. Removing fossil fuels from electricity generation, especially coal, but also natural gas. Both have a very significant impact on the final result and both create CO2 and methane emissions.
  2. The immediate adoption of a strategy to convert all vehicles from fossil fuels to ethanol. This will be simpler, quicker, cheaper and less resource depleting than the currently favoured electric car strategy.

In addition, many small actions to remove greenhouse gas emissions will accumulate to have an appreciable impact on the final result.

Coronavirus: Macro Analysis

Coronavirus: Macro Analysis

We have enough data available on coronavirus to be able to do some macro analysis on its progress and to understand the protective measures that are needed to manage its impacts.

Fatalities

There are currently few reported fatalities for coronavirus for people below 50, although for those from 30 to 50, about 20% of identified cases have been hospitalised and about 1% have gone into intensive care (ICU).

For those between 50 and 70, there are varying numbers, but it would appear that about 1.5% of reported cases of coronavirus have died. About 20% of identified cases have been hospitalised and about 5% have gone into ICU.

For those over 70, according to the USA statistics about 10% of reported cases have died. About 30% of identified cases have been hospitalised and about 6% have gone into ICU.

The likely outcome will vary for each nation depending on the success in caring for sick patients and the age distribution of the population. However, for the purpose of this analysis, an average fatality rate for infected persons has been estimated to be 1%.

For more detail, go to https://www.vox.com/2020/3/23/21190033/coronavirus-covid-19-deaths-by-age, which presents an interesting analysis.

Reported Cases

In all the nations where fatalities from coronavirus are significantly more than 1% of reported cases we have good reason to believe that the reported cases are significantly understated.

This particularly applies to Italy and Spain. It is apparent in these nations that community transmission has meant that testing could not possibly keep up with the rate of infection, thus leaving vast numbers of people untested. Also, the kind of contact tracing that has been so effective in Singapore and elsewhere would now be relatively ineffective. Thus it is not appropriate to treat the Italian and Spanish coronavirus experience as a guide to the future trajectory of those nations still striving to make contact tracing work.

It is also the case that symptom-led counting of reported cases will significantly understate the numbers of people who have met (and defeated) the coronavirus. It will miss those who have no symptoms (those who are asymptomatic).

Here are the details of reported cases of coronavirus in those nations most hard hit by the virus, with a simple estimate of unreported cases:

  • China: reported 81,591 + 32,000 asymptomatic = 113,591.
  • Italy: reported 69,176 + estimated unreported = 682,000.
  • USA: reported 52,145 + estimated unreported = 68,500.
  • Spain: reported 39,676 + estimated unreported = 280,800.
  • Germany: reported 32,781 (deaths 157).
  • Iran: reported 24,811 + estimated unreported = 193,400.
  • France: reported 22,616 + estimated unreported = 110,000.
  • Switzerland: reported 9,877 + estimated unreported = 12,200.
  • South Korea: reported 9,037 + estimated unreported = 12,000.
  • United Kingdom: reported 8,164 + estimated unreported = 42,200.
  • Netherlands: reported 5,580 + estimated unreported = 27,600.
  • Belgium: reported 4,269 + estimated unreported = 12,200.
  • Australia: reported 2,144 (deaths 8).
  • Indonesia: reported 686 + estimated unreported = 5,500.

In most cases, the reported cases will reflect those who report themselves to be tested because they show symptoms of the disease. If we use the China data as a rough guide (in the absence of an actual study), we could say that about one third of all cases will be asymptomatic. Taking that into account, we could say that a real issue with undiagnosed cases of coronavirus currently applies in Italy, Spain, France, United Kingdom, Netherlands, Belgium, Iran and Indonesia. However, it is not necessary to resolve that issue: it is more important for all nations to address the fundamental problem. That is to stop the spread of the disease within their own borders.

Herd Immunity

From past pandemics, it has been estimated that 60% of a population has to be exposed to a virus before community immunity can be achieved.

None of the nations listed above have come even close to that number. The social consequences of allowing 60% of the population to be infected will be dire. It will be like a plague in the Middle Ages. It is unlikely that letting the disease run its course will be an acceptable approach to ending the coronavirus pandemic.

Social Isolation

Infection with coronavirus is passed from one person to another. A number of nations are attempting to enforce social isolation by introducing laws that make it more difficult for all people to mix with each other. These laws are now being introduced in the United Kingdom, United States, Australia, New Zealand, India and in many other places.

Such laws are probably necessary in order to create a new social environment in which those who are infected with the virus isolate themselves from others, with the intention of these laws being that infected persons cannot pass on the disease. Yet it is a first step, not a long term solution. This is because one can expect that the social consequences of this kind of widespread shutdown of normal societal relations and economic activity will be intolerable quite quickly, with the cure being considered to be worse that the disease.

Along with such (temporary) laws, Australian governments require everyone who has the disease to self-isolate (if not in hospital). This also applies to everyone who has had contact with that person (while infected). All such people are monitored by a health workers (over the phone – perhaps by skype) every day until the monitoring period ends. One assumes that other nations are taking similar steps.

Draconian policies like these are required in every nation that wishes to prevent the spread of this disease within their borders. People who come from nations that do not implement policies like these are likely to find it difficult to travel to countries that do implement such draconian policies.

Scott Morrison wins Australian Federal Election

Scott Morrison has overcome the attempt to re-introduce class warfare into the Australian electoral system with a “steady as she goes” campaign strategy.

Labor’s Campaign

In a carefully calculated attempt to re-invigorate union control of the Australia economy, the ALP set out a programme to target all Australians who were not unionists. This programme included the following “difficult to explain” elements:

  1. Eliminating Franking Credits for retirees in self-managed superannuation funds, but keeping them for retirees who are in externally managed Superannuation funds, which are mainly union-managed funds.
  2. Supporting the proposition that there should be an increase to the minimum wage without regard to the possible negative impact on jobs.
  3. Allowing lawless union activity and removing the “industrial umpire” in the construction industry.
  4. Radical action on climate change beyond that agreed at COP21 and beyond that committed to by other comparable nations, with little real consideration of the employment consequences of this approach. Given its rhetoric, and reliance on Greens preferences, the ALP were unable to articulate a policy fix to work around this. This did not trouble voters in Melbourne or Canberra, since they did not perceive a risk to their own jobs, but it did worry voters in Queensland.

Maximising Scott Morrison’s win

Continuing failure of the Liberals to win over Canberra’s voters (and the opinion-makers at the ABC and SBS) will be a cancer on future Liberal policy making. In addition, the time is approaching when the ALP will not be able to govern in its own right, but in a future time its only hope will be to govern in coalition with the Greens. Already, the ALP cannot win many seats without Green preferences.

For the Liberals, it will not be enough to point out the overt socialism of Green leaders or the economic dead-end of Labor’s class war. Furthermore, the Greens are already starting to show more pragmatism than the ALP on policies like the Franking Credits changes, with plans to protect less wealthy investors. The challenge for the Liberals will be to come up with their own version of “reasonable and easily defensible policies.” Here are some suggestions for immediate action:

  1. Fix the “wages drought” by arguing for a $1 hour increase in the minimum wage in this year’s Fair Work hearing.
  2. Make Mabo Day a Federal public holiday.
  3. Explain that Australia is cutting its CO2 emissions in accordance with its commitments to COP21.
  4. Explain that the Coalition has a policy to provide dispatchable electricity via Snowy 2.0.
  5. Protect jobs in vulnerable sectors, such as horticulture, via modest tariffs.

Wages Drought

The government and the Reserve Bank have already agreed that inflation should be between 2% and 3%, yet it is currently running below that level. We know that inappropriate across-the-board increases in wages are the main cause of runaway inflation. Surely the corollary of that is that inappropriate wage-freezes are the cause of inflation running at too low a level. Therefore, it follows that a significant minimum wage increase at this time is appropriate. Don’t drop the ball on this, Scott Morrison. If you do, you will be opening up the field to the ALP to foster discontent.

Most of Australia’s export industries will not be hurt at all by this change, as they operate at the other end of the wages spectrum, with mining, medical research and IT sectors paying well above the minimum wage to most of their employees. The tourism sector could suffer some short-term impacts, but it is a highly vulnerable sector in any case with many other factors playing a more important part than the wages paid to minimum wage employees.

The import-competing sectors could suffer some pain, but the government has the means to address this issue by another mechanism, discussed below.

A change in the minimum wage will be much more effective in restoring balance to the Australian economy than can be achieved by cutting interest rates since that is likely to have other and unmanageable consequences.

Mabo Day

Most Australians recognize the importance of Australia Day. It recognizes the beginning of European settlement in this nation; most Australians are Europeans. On the other hand, Mabo Day could be an equally important day in Australia’s calendar. It would be a day to remember when the original inhabitants of this land began to get legal title to the land upon which they are still living. It can be a day when Aborigines, Torres Strait Islands and the European and other immigrant peoples remember and celebrate the original inhabitants of this land. Scott Morrison, don’t you think it deserves to be recognized?

COP21

In Paris, Australia made a voluntary commitment to cut greenhouse Gases by 26% to 28% by 2025 from 2005 levels.

Since Australia only emits 1.3% of the world’s greenhouse gases, it is not possible for Australia’s action to have any measurable impact on global warming. Therefore, it is appropriate for Australia to be a follower, not a leader in this matter, especially since its commitments to COP21 follow that requirement. Certainly we can do more, provided it can be done without seriously damaging our own economy and without destroying the jobs and incomes of ordinary Australians. This is the lesson of the recent election, which was claimed to be a “referendum” on this subject. The nation’s action on climate change should bring the nation together, not divide it, as the ALP and the Greens wanted to do. On this point, Scott Morrison was clearly correct.

While many in the electorate like the idea of Australia leading the world on climate change action, and probably most of the voters in Canberra (which includes the civil servants advising the government and the nationally-funded broadcasters, the ABC and SBS), it will have a cost in terms of jobs, a point which voters in Queensland clearly perceived.

In addition, Australia should not be party to the worldwide green conspiracy to deprive India and other emerging nations of access to cheap electricity via Australia’s coal. When the West and China emit less CO2 than India it may have a moral right to dictate how India should proceed in this matter. Whether it should do so, even at this point, is a matter of geopolitics as well as moral arguments.

Snowy 2.0

Only the Coalition has a workable policy to turn generated electricity into dispatchable power. This important contribution to this subject was made by the former PM, Malcolm Turnbull, being a policy that Scott Morrison has retained. Of course, Snowy 2.0 is only a start, but this “solution” is likely to be repeated, with the Kidson power project in North Queensland also being indirectly supported by the Queensland Labor government.

On this question, Labor and the Greens have been very quiet, hoping not to give any credit for real action on climate change to the Coalition. Scott Morrison and the Coalition should not allow this policy vacuum in their opponents’ rhetoric to continue to go unchallenged.

Tariffs

All major parties have a blind spot on tariffs, believing for some reason or other that minimum wage Australians can compete with people overseas on half, quarter and even one-tenth of Australian wages and conditions without any problems.

This is a manifestation of the arrogance of the Canberra bubble and I seriously hope that Scott Morrison can burst this bubble.

Critiquing Some Labor Policies

Franking Credits

The system of Franking Credits is an innovative approach to avoid double taxation for Australian investors. It was introduced by a previous ALP government. It had the significant benefit that overseas investors in companies of all kinds were no longer better treated than local investors (since overseas investors are only taxed at a notional rate on dividends and interest earnings). The outcome of the ALP’s tinkering could have been the beginning of the end of this scheme in its entirety, a result in which Labor’s class-war warriors would have rejoiced, urged on by the Liberals’ hard-right “free trade” faction. A plague on both their houses!

Negative Gearing

The system of negative gearing for housing investments has been a thorn in the side for taxation system designers of all political persuasions. A previous ALP government tried removing it, but had to unwind the change because it immediately caused property rents to increase. Undeterred, ALP’s Bowen planned to try to do this again. The problem with this plan is that rents provide a very poor return on residential property returns, with the shortfall made up by immediate tax deductions for the loss on property investments and the hope of future capital gains. Ignoring the likely adverse outcomes of a policy platform is not recommended.

Capital Gains Tax changes

There is a fairness aspect to the Capital Gains Tax discount and there is an economic incentive aspect. The fairness aspect relates to the “lumpy” nature of capital gains since, for individuals selling a business and receiving a capital gain, this could be a once-in-lifetime event. In this case, taxing at the full marginal rate of tax applicable in that year would be unfair. Even though averaging could be introduced at this point, there is a more important element that should be included when considering capital gains taxes. This relates to the nation’s need for capital investment and capital accumulation in order to maintain the nation’s prosperity into the future. Encouraging investment via the capital gains discount should help to build up the nation’s capital; even negative gearing also serves this purpose. At present, Australia has a problem with insufficient capital investment. The need for more investment is a matter that does not appear to have been considered by the ALP when proposing to reduce the capital gains discount and their changes to negative gearing. While their proposals had a ready audience among those who do not invest for the future, the ALP has no excuse for not putting national interest ahead of a “cheap win” in these matters.

Conclusion

Scott Morrison is to be congratulated for running an effective campaign, highlighting some of the inadequacies in the “bold agenda” put forward by Labor. It is now up to the Prime Minister to lead a government that really does work for all the people, not just for those who voted for the Coalition.

COP24 Katowice – CO2 Emissions

CO2 Emission targets for COP24 naturally follow on from COP21, which for real contributors was a cut of about 1% of total CO2 emissions – 356,000 tonnes of CO2 per year – until around 2025.

Given the range of global disparity in CO2 emissions, a cut of about 356,000 tonnes of CO2 per year is probably as much as can be realistically achieved in this period, at least until new ways of cutting CO2 emissions are fully implemented or even new ones invented. This could then be a CO2 emission reduction target for COP24, out to 2025.

Energy-Related Emissions – Actuals

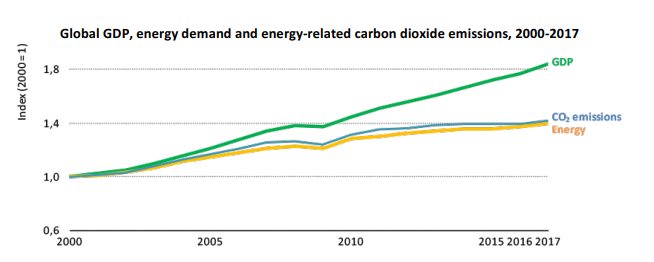
When the actual figures for total CO2 emissions come out we will know the truth about 2017, but at present we can say that energy-related emissions grew by 1.4% in 2017. However, it is noteworthy that emissions have not followed the growth in GDP.

CO2 Emissions vs GDP

While the USA continued the downwards march of its CO2 emissions, most of the increases in 2017 can be attributed to China (up 1.7%), European Union (up 1.5%) and the Developing Asia (up 3.1%). Developing Asia (i.e. excluding China) can be excused for its increase in CO2, since this region is well below the world average CO2 emissions per person.

COP24 – China’s emissions

Even though China’s emissions are below those of most western nations, they are well above the global average CO2 emissions. If CO2 cuts are to be achieved China cannot just stand on the sidelines and point the figure at other nations.

China cannot even say, “India’s emissions are also increasing.” The fact is that India needs to catch up on its electrification, and there is plenty of scope for it to do so. Global average emissions are around 5.0 tonnes per person per year. India’s emissions are running at less than 2.0 tonnes per year.

In regard to 2017, seasonal factors could have played a role if some emissions had “moved” from December 2016 to January 2017, (as movements in atmospheric CO2 readings seem to indicate). But the real question to be answered by China is, “What will be energy-related emissions in 2018?”

COP24 – Europe.

Europe’s failure to cut emissions in 2017 is very disappointing, particularly given the EU’s criticism of other nations (particularly USA) when the USA is actually cutting emissions.

Factors contributing to the EU’s setback include Germany’s partial loss of faith in nuclear and the dysfunctional EU ETS scheme. The question for the EU is, “What are you doing to remedy your failures?”

COP24 – Immediate CO2 Emissions target

COP21 Paris required nations to set their own targets for CO2 emission reductions. Leaving to one side China’s effective non-participation in any realistic way in the “commitment” process, it was an effective way to proceed, since non-binding commitments are likely to be more ambitious than binding commitments.

There does not appear to be any basis to change the COP21 overall target, since cuts of this magnitude will contribute significantly to the goal of decarbonising the world’s economy.

There are even ground to believe that unanticipated cuts have already been delivered. Two possibilities stand out:

  1. China’s well-publicized cuts in coal consumption and the move to use higher quality coal should have cut China’s emissions  – but did this happen?
  2. A cut in India’s inefficient use of fuel for cooking and other purposes due to an increase in electrification of that nation should have given rise to a cut in net emissions – has this been factored into the IEA numbers?

COP24 – Future CO2 Emission target

Even higher rates of CO2 emission reductions are possible in the medium term. At present, the most fruitful lines of future development, not fully factored into the current targets, are:

  1. Increasing penetration of pumped-hydro as a way of dealing with the problem of unpredictable supply of electricity from wind-farms, without bringing in its train the “CO2 cost” of using peak electricity gas-powered generators.
  2. Increasing the community’s confidence in the long-term safety of nuclear-powered electricity generation, possibly via new technology currently under evaluation, leading to a higher level of take-up of nuclear energy.
  3. Eventual replacement of all petrol and diesel-powered passenger vehicles with electric vehicles.

If these all came to fruition, along with others not yet considered, a doubling of the annual expected CO2 emission reductions to one million tonnes of CO2 per year is not beyond practical delivery. This could be target set at COP24 for after 2025.

COP24 Katowice – Real Issue

COP24 Katowice is danger of being strangled by non-central issues. The real issue for this international conference on climate change is understanding CO2 and the reduction in emissions required for effective action.

COP23 – Attempted Sidetrack

An attempt was made to sidetrack COP23 (2017) by asserting that CO2 emissions would increase in that year by 2%, with the strong implication that the stall in CO2 emissions since 2014 had come to an end. Yet it does not appear that the “stall in emissions” has really come to an end. Instead, cuts in emissions are continuing around the world. Despite disappointing results in a few places, there does not appear to be a good reason to abandon the hope that the commitments made at COP21 will eventually result in significant and continuous cuts in CO2 emissions.

GDP vs CO2 Emissions
Demonstrating the “Stall”

COP24 – Potential Side Issues

When we are discussing climate change as a result of global warming, the real issue must always be CO2 emissions. Unless CO2 emissions are eventually cut to around a net zero level, global average temperatures will continue to rise and the disruptions that are currently occurring in a number of regions throughout the world will continue to happen.

Some are worried that a significant rise in ocean levels is inevitable, since the upwards march of atmospheric CO2 is inexorable. While a number of islands and low-lying regions have reason to fear a significant rise in ocean levels, it is currently quite unlikely that the doomsday scenarios being put forward in scholarly journals have any basis in a realistic forecast of future CO2 levels. The reason for this is that CO2 emissions have now stalled and should be forecast to be cut, not to continuously increase.

However, the looming side-issue for COP24 is the subject of the fund agreed at COP21 to provide money to mitigate the effect of climate change. The decision to set up this fund was a mistake and it has already been shown to be ineffective and misconceived.

No matter how much money is provided to this “mitigation fund” and no matter how well the money is spent, it will not stop global warming or the climate change effects. The main aim of COP24 should be capping global warming by reducing CO2 emissions. A desirable end target is to cap atmospheric CO2 at 450 ppm. It is currently around 410 ppm. This should be the real issue at COP24.

Energy-Related Emissions – Actuals

When the actual figures for total CO2 emissions come out we will know the truth about 2017, but it is true that energy-related emissions did grow by 1.4% in 2017.

While the USA continued the downwards march of its CO2 emissions, most of the increases in 2017 can be attributed to China (up 1.7%), European Union (up 1.5%) and the Developing Asia (up 3.1%). Developing Asia (i.e. excluding China) can be excused for its increase in CO2, since this region is well below the world average CO2 emissions per person. On the other hand, China and the European Union have a case to answer for their increases in CO2 emissions in 2017. In China’s case, seasonal factors could have played a role if some emissions “moved” from December 2016 to January 2017, (as movements in atmospheric CO2 readings seem to indicate). Germany’s partial loss of faith in nuclear and the dysfunctional EU ETS scheme could also have played a role. Since Europe has claimed for many years a leading role in the climate change debate, this more recent increase in CO2 emissions in the EU is very disappointing.

COP24 – Immediate CO2 Emissions target

COP21 Paris required nations to set their own targets for CO2 emission reductions. Leaving to one side China’s effective non-participation in any realistic way in the “commitment” process, it was an effective way to proceed, since non-binding commitments are likely to be more ambitious than binding commitments.

One can summarize the proposal cuts as representing a goal of an overall cut of about 1% of the level of 2015 emissions from 2016 onwards. If this were achieved, it would mean a cut of 356,000 tonnes of CO2 per year until around 2025.

Given the range of global disparity in CO2 emissions, a cut of about 356,000 tonnes of CO2 per year is probably as much as can be realistically achieved in this period, at least until new ways of cutting CO2 emissions are fully implemented or even new ones invented. This could then be a CO2 emission reduction target for COP24, out to 2025.

Using this number as a base, one could expect atmospheric levels of CO2 (at Mauna Loa) to increase by 2.35 ppm per year in 2018 (standard deviation 0.41 ppm), yet for each month since June 2018 they have been increasing at a (rolling) annual rate of around 2.0 ppm per year. While there is reasonable skepticism about the usefulness of this statistic in a short-term context  (see the article “Real-time verification of CO2 emissions”), at least it is on the side of a reduction, not on the side of an increase.

Given that increases in atmospheric CO2 from previous years’ ocean warming (measured by the Oceanic Nino Index) should now have worked their way through the system, we can be hopeful that some significant, previously ignored, potential cuts in emissions have occurred. Some possibilities stand out: 1) China well-publicized cuts in coal consumption and the move to use higher quality coal; 2) A cut in India’s inefficient use of fuel for cooking and other purposes due to an increase in electrification of that nation.

COP24 – Future CO2 Emission target

Even higher rates of CO2 emission reductions are possible in the medium term. At present, the most fruitful lines of future development, not fully factored into the current targets, are:

  1. Increasing penetration of pumped-hydro as a way of dealing with the problem of unpredictable supply of electricity from wind-farms, without bringing in its train the “CO2 cost” of using peak electricity gas-powered generators.
  2. Increasing the community’s confidence in the long-term safety of nuclear-powered electricity generation, possibly by new technology currently under evaluation, leading to a higher level of take-up of nuclear energy.
  3. Eventual replacement of all petrol and diesel-powered passenger vehicles with electric vehicles.

If these all came to fruition, along with others not yet considered, a doubling of the annual expected CO2 emission reductions to one million tonnes of CO2 per year is not beyond practical delivery. This could be target set at COP24 for after 2025.


Global 20 per cent Tariffs – not a scary prospect

Reserve Bank modelling indicated that, if there were global 20 per cent tariffs on EVERYTHING,  the effect on Australia would be minimal. Clearly, tariffs are not a curse, or evil, or even a serious problem; and there are significant upsides to revisiting tariffs.

Reserve Bank of Australia

A recent freedom of information request resulted in the release of Reserve Bank modelling that concluded that, if there were a regime where every country slapped a 20 per cent tariff on every other country (global 20 per cent tariffs), the effect on the $A was not significant (it could appreciate or depreciate – implying it was a line ball). The effect on unemployment would be minimal – a 0.25% increase, and the effect on GDP would also be minimal – it would shrink by 1% by 2021.

This is not a proposition that is ever likely to been fairly considered by Australian Treasury, since it is ideologically committed to unrestrained free trade, as the relevant Australian government ministers make clear at every possible moment. However, it is a proposition that I presented for discussion in January 2018.

Consequences of Global 20 per cent Tariffs

While Reserve Bank modelling shows that global 20 per cent tariffs could be easily accommodated in Australia, such a change to the global tariff regime is also likely to have positive impacts on the body politic, which is the major interest of this blog. Two of these impacts are considered under the following headings:

  1. Reduced top-level income.
  2. Higher wages and more jobs.

Both of these movements in income will have the effect of reducing inequality across the Australian landscape. The question is whether this will be good for Australia as a whole. I would say “Yes,” but that is a personal and political judgment, not an economic one.

A regime recommending global 20 per cent tariffs would provide an economic model that aims to provide jobs for persons of every skill and education level, instead of the current model that leads to a winner-takes-all economy. Indeed, all western countries have a system in which some segments are able to compete very effectively, but with the rest of the population being left relatively worse off. This is source of current trend towards more inequality – it is not caused by a wicked capitalist plot. The source of this problem is the dominant economic theory, supported by major parties in most Western countries. (In Australia the strongest supporter of this economic theory was Prime Minister Malcolm Turnbull, a lifetime beneficiary of this approach. While it was not this Achilles Heel that brought him down, it did not help his cause, even though he was oblivious to this fact. The king is “dead;” long live the (new) king!)

Reducing Top-Level Income

Without being privy to the details behind the Reserve Bank modelling, one can be sure that the knock on GDP would primarily come from a decline in incomes of those who are currently winners in the current regime. These are globally competitive Australian firms, who would lose part of their first-mover-advantage. Since we do not have many of those, the impact would be relatively small. It would also impact on CEO salaries, since company boards would no longer have to select a CEO who can be the “best in the world,” in order to compete successfully with ever other CEO in the same industry. Competition would more likely to focus on finding a CEO who can compete within Australia. (Finding the “best CEO” is not always the best outcome, with Telstra’s and AGL’s unhappy experience being useful pointers in that regard.) This change would also have the socially desirable outcome of reducing inequality.

Higher Wages and more Jobs

Australia (and other Western nations obsessed with free trade) are currently following a view of an ideal world in which every country aims to do only those things that it is best equipped to do. Theoretically, a country does not grow its own food if someone is able to do it better; it does not make its own goods if someone else is able to make them cheaper; it even doesn’t educate its own people if they can get a better education elsewhere. It sells off all its businesses to the highest overseas bidder, ignoring the long-term consequences of this action.

Under this scenario, the government of each country allows the global market to have free play, based on the argument that, under this system, the collective entire global system is better off, in the (faint) hope that this will then trickle down to individuals in each and every country. At the same time, economists pay no attention to need for each nation to provide jobs for its own people, despite their respective education and skill levels. The world is considered to be a single pudding, with everyone having an equal chance to get their own piece (whether small or large).

The real world is not like this, thank God. In the real world most governments are responsible to their own people, not to some super-intelligent bureaucracy. (The EU is a notable exception, giving extraordinary powers to un-elected bureaucrats – a living lesson in the folly of delegating policy to a “super-intelligent” bureaucracy.)

The simple fact is providing jobs in a diversity of industries, businesses and government services provides better opportunities for everyone to get a job that suits his or her own talents. It is no good talking about Australia becoming a “knowledge economy” – not everyone has the talent to  be a part of this new dreamland economy that “our betters” are planning for us.

While there is a place for a safety net, wages are best set as a function of the demand for workers, so that when there are more jobs than workers, wages will rise for those workers. Australians certainly do not want to repeat the situation in France where restaurateurs are short of workers and want to employ migrants who currently do not have legal rights to work, rather than attracting more entrants into their industry by increasing the wages of their own workers!

Any reasonable and competent government would work towards ensuring that a virtuous situation of jobs for all continues to lift the income of lower paid workers, through education, and improved skills at work.

Efficiency & Global 20 per cent Tariffs

There is a lot of nonsense spoken about the improvement of efficiency as a result of removing tariffs from Australian manufacturing. The plan fact is that the combination of tariff cuts and the currency revaluation were so severe they led to the smashing of Australian manufacturing. The car industry is a case in point. The EU have a 15 per cent tariff regime for cars; Australian leaders thought that a 5 per cent tariff was so good it reeked of “economic virtue.” Yet the EU still has a car industry, despite competition from Asia. Add to this the failure to effectively manage the $A during a period of over-valuation of the $A against the $US, which meant an effective 40% negative tariff working against Australian manufacturing. We congratulated ourselves on our economic management while “Rome burned!”

Innovation

Australia’s political leaders hope that “innovation” will be Australia’s economic saviour in the coming uncertain times. Having smashed manufacturing in a search for impossible to achieve domestic efficiency – sufficient to overcome cheaper labour overseas and larger domestic markets – these leaders need to find something new.

There is some hope of this front. Australia’s mining industry is a world leader, and has generated sufficient profits to be able to fund continuous innovation. Australia’s innovation potential has delivered three world-competitive health product and service companies – CSL, Cochlear and ResMed. It has also delivered four world-class players in Information Technology.

In this way, we can see innovation has delivered good returns for those who are able to be central players in these fields. The profits generated mean that further innovations are able to investigated and pursued if they look promising. The same profits are also able to fund above average salaries.

Yet innovation of this kind is of little direct assistance to those who are not in the top 10% of ability and advantage. It is too easy for the government to just sit back and admire the success of those firms and sectors. The real challenge for the nation’s government is to aid the remaining 90% to achieve success appropriate to their own natural abilities.

Given the natural creativeness of Australians, and their aspirations for a “better” life, all the Australian government has to do is ensure that Australian firms can earn sufficient profit to fund their own innovation programmes. Yet it cannot do this by crushing employee wages and thereby helping firms to increase their own profits by that route. It must somehow increase the potential for higher margins between revenue and costs.

Insofar as governments have any role in this, the first step is to decide whether it wants to establish conditions that serve primarily to increase efficiency of firms – by making all businesses compete on a “level playing field” with the rest of the world – or by providing local firms with a small advantage over global competitors.

Australia had tried the “efficiency route” and delivered a very unpleasant smelling result. It is about time it tried the “innovation route” and then to see what this will deliver.

Global 20 per cent Tariffs & a Level Playing Field

There is no such thing as a “level playing field.” Each country is different, and the pursuit of a level playing field will just mean progressively lower wages for everyone except the most successful of our fellows. This is because of the current world surplus of labour; this means global capital can always seek out the lowest wage employee that can do the job that it wants to have done. Ironically, this is the course of action required by governance conventions – boards have little choice in this matter.

The current WTO objective of “lifting all boats” by lowering all tariffs to zero rating is entirely misconceived. Rather, this strategy will trap developing nations in a permanent dependency on the West. It is something that China will never countenance, nor should any nation, whether developed or developing.

A regime with a target of global 20 per cent tariffs would give emerging industries in developing and developed countries a chance to find a modest level of support so that they can find their feet. It never needs to be reduced below 20 per cent, unless there really is a compelling case for goods to be 20 per cent cheaper. What would be the argument for that? The wealthy getting luxury goods cheaper?

Conclusion

It is cringe-worthy for economists to cite 1930s protectionism as if it provided the evidence for embracing free trade. Don’t they know that the 1930s were a very difficult period because of the crash of the world economies from over-active speculative activities in the 1920s?  A similar thing happened in 2007 and 2008, and the worldwide rejection of protectionism did little to make recovery faster than in the 1930s. Food for thought, eh?

Don’t economists know that America’s economic powerhouse was established in the 19th century, building its strength behind tariff walls? Don’t they know that the world became a much more prosperous place at the same time as protectionist regimes were in place in most of the nations of the world, namely, in the 1950s, 1960s and 1970s?

Rather than protectionism being ridiculous, as opponents of Donald Trump seem to think, the arguments presented here are just standard economic principles. Unfortunately, free trade advocates  have stopped thinking from first principles, and have adopted a convenient, if bogus, theory.

If economists did a bit more original research, as well as looking at history, they would realise that an approach that led to global 20 per cent tariffs would benefit all nations, and certainly “lift the boats” of all developing nations. All that is required is for national economic leaders to seize the moment and the opportunity and argue the case cogently.
Argentina’s Economic Malaise

Argentina’s economic malaise is almost entirely due to blindly accepting prepared economic prescriptions, rather than finding its own way forward. It started with socialism and then accepting Ricardo’s theory about Comparative Advantage, leading to the collapse of a once thriving economy.

Argentina is in the unique position as a country that had achieved advanced development in the early 20th century but experienced a reversal. This has inspired an enormous wealth of literature and diverse analysis on the causes of this decline, but there is little evidence that this analysis has come close to discovering the reason for Argentina’s economic malaise.

Argentina’s Economic Malaise & comparative advantage

The history of Argentina’s economic health is littered with pointers to the unhealthy consequences of the “advice” of economists.

Economic historians point out the Argentina’s economic advantages, placing it squarely in the real of Ricardo’s “comparative advantage.” Here is a summary presented in Wikipedia:

Argentina possesses definite comparative advantages in agriculture, as the country is endowed with a vast amount of highly fertile land. Between 1860 and 1930, exploitation of the rich land of the pampas strongly pushed economic growth. During the first three decades of the 20th century, Argentina outgrew Canada and Australia in population, total income, and per capita income. By 1913, Argentina was the world’s 10th wealthiest state per capita.

Ignoring the economists’ mantra that each country should concentrate of its own comparative advantage, from 1930 to 1976, the various governments of successfully diversified the nation’s economy by engaging in a process of industrialization, behind a protective tariff regime.

To the amazement of economists and economic historians, “Despite this [Argentina’s protectionist regime], up until 1962 the Argentine per capita GDP was higher than of Austria, Italy, Japan and of its former colonial master, Spain.” So one economic historian amazingly concluded, “Beginning in the 1930s, however, the Argentine economy deteriorated notably.

So one can see, even though economic policies that do not respect Ricardo’s theory can serve a country very well, most economists are so blind they cannot see what stares them in the face.

What they cannot or will not see is that no country is better off in the long term by concentrating only on their strengths. Only a diverse economy can work for everyone, not just those who are occupied in the “advantaged field.”

Argentina’s Economic Malaise – Peronism

Part of coup that seized power in 1943, Juan Perón became Minister of Labour. Campaigning among workers with promises of land, higher wages, and social security, he won a decisive victory in the 1946 presidential elections. Under Perón, the number of unionized workers expanded as he helped to establish the powerful General Confederation of Labor.  This sowed the seeds for the later humiliation of Argentina’s economy.

Beginning in 1947, Perón took a leftward shift in economic policy, first breaking up with the “Catholic nationalism” movement. This led to gradual state control of the economy, reflected in the increase in state-owned property,  control of rents and prices. The expansive macroeconomic policy, which aimed at the redistribution of wealth and the increase of spending to finance populist policies, led to inflation.[95]

Thus it is with socialism everywhere! The Whitlam experiment is Australia’s practical demonstration, with unsustainable higher wages, out of control inflation, and leading (socialist) economists saying, “There is nothing to see here – all is OK.”

In the 1950s and part of the 1960s, the country had a slow rate of growth in line with most Latin American countries. Stagnation prevailed during this period, and the economy often found itself contracting, mostly the result of union strife.[50]  Is this not the story of Australia after Whitlam, until Labor’s Hawke and Keating brought it to an end?

The story of Argentina’s economic malaise can be repeated, with a varied story line in many countries.

Argentina’s Economic Malaise – After Peron

Arturo Frondizi won the 1958 presidential election in a landslide. He failed to restore prosperity to the nation. He was replaced in another coup in 1966, which sought to restore national prosperity, beginning with more state control of money, wages and prices.

After 1966, in a radical departure from past policies, no doubt encouraged by the “smartest economic minds,” the Ministry of Economy announced a programme to reduce rising inflation while promoting competition, efficiency, and foreign investment. The anti-inflation programme focused on controlling nominal wages and salaries. It had striking benefits, with inflation decreasing sharply, decreasing from an annual rate of about 30% in 1965–67 to 7.6% in 1969. Unemployment remained low, but real wages fell, as they always will once Comparative Advantage theory is allowed to take control of economic thinking.

By 1970, the authorities were no longer capable of maintaining wage restraints, leading to a wage-price spiral. The lower real wages that are inevitable under the new economic orthodoxy are completely unacceptable to the majority of the people. In a democracy there can be only one outcome – an change of government.

Despair over the incompetent economic management of the post-Peronist period led to the election of the Peronist, Hector Cámpora in 1973 and then Perón himself soon after. When he died in 1974, he was succeeded by his wife, until she was deposed in a military coup in 1976.

The new Perónist regime was characterized by an expansive monetary policy, which resulted in an uncontrolled rise in the level of inflation. Here we have the same problems being repeated again – when will socialists ever learn?

Comparative Advantage – Continuing Problems

The dominance of the economic theory of Comparative Advantage led to a process of continuous decline. Just how the Argentinian economists thought that Argentina could compete with the USA with its own comparative advantages, which are numerous, is incomprehensible. Holding up manufacturing firms via state support just was not an effective band-aid solution. Argentina’s industrialization fell to levels maintained in the 1940. So much for a diversified economy, full employment, high wages, and political stability.

Argentina’s Economic Malaise – Today

The socialists were thrown out in 2015 and Mauricio Macri became president. At least Macri rejected socialist lies, but nothing would be fixed since he had swallowed economists’ Free Trade Lies. When he tried to implement the economists’ prescription to get Argentina back on its feet, he failed and Argentina’s Economic malaise continues today.

Yet economists still think that the solution to Argentina’s economic problems is more of the same, with the Financial Times completely perplexed that Macri’s presidency has not solved Argentina’s problems.

Argentina has embraced economic orthodoxy before, only to be blindsided by financial markets. This week’s mounting panic, which has seen the peso plummet and prompted the central bank to raise interest rates to 60 per cent, is just the latest example, prompting many to wonder: what has President Mauricio Macri got wrong?

The Financial Times cannot accept that the problem is in the economic model that it pushes every day of the week. Instead, it comes up with the lame excuse that one answer is “poor communication.” Actually, it is the only answer that it is willing to offer.

The same article cites an Argentinian economist, who says that there is no explanation for the current crisis.

“There is no logical explanation for what is happening,” said Christian Buteler, an Argentine economist, who called on the authorities to explain this “alarming” situation that is “completely out of control”.

The article concludes with argument from another Argentinian (capitalist) economist, reminiscent of arguments that I heard from (socialist) economists during the Whitlam era, “There is nothing to see here – all is OK.”

“[The problem is small] compared to the size of the market fear,” he says, arguing that the financing gap was small for Argentina’s $545bn economy.

Capitalist economists seem to think that ordinary workers in developed nations should accept ever falling wages and less secure employment. If challenged, they say that automation is the problem and will be increasingly the problem. Yet this is another lie. National states coped with the automation of industrial processes, but they will never be able to cope the with automation of other process if the real economic levels are handed over to global corporations in a fit of ideological blindness.